Introduction
With its constant dynamism, the cryptocurrency market can be both captivating and intimidating for experienced investors and curious novices alike. Technical analysis in cryptocurrency exchange development, studying historical price movements, crypto graphs, and patterns, is vital in navigating this ever-shifting landscape. However, understanding and reading crypto chart patterns is a fundamental skill that empowers you to make informed trading decisions.
This blog delves intocrypto chart patternsand graphs***.*** It equips you with the knowledge to decipher the language of price fluctuations and analyze or identify potential trading opportunities.
What are Crypto Chart Patterns?
Crypto chart patterns are formations that appear on price charts over time, reflecting market participants’ behavior. They provide predictive cues about potential changes or continuations in price trends. By recognizing and interpreting these patterns, traders can pinpoint entry and exit points, manage risks, and optimize trading strategies to achieve consistent profitability.
Importance of Crypto Chart Patterns
Understanding crypto chart patterns is essential for several reasons. Firstly, they offer insights into market sentiment and investor behavior, enabling traders to anticipate and react to price movements effectively. Secondly, these patterns help establish clear support and resistance levels, crucial for defining risk levels and setting profit targets. Lastly, mastering chart patterns enhances traders’ ability to execute disciplined strategies based on well-defined market signals, ensuring consistency in trading outcomes.
Time Frames and Intervals in Crypto Chart Patterns
Time frames in crypto chart patterns refer to the duration represented by each data point on a chart. They range from short-term intraday charts (minutes to hours) to longer-term daily or weekly charts. More extended time frames tend to provide more reliable signals due to increased data accumulation and reduced market noise, influencing the significance and effectiveness of chart pattern analysis.
In analyzing crypto chart patterns, three primary time frames are used:
1. Intraday Time Frames: These short-term frames capture price movements within a single trading day, ranging from one minute to five minutes, 15 minutes to 30 minutes, and up to an hour. Day traders seeking to capitalize on minute-to-minute price fluctuations within the day find them ideal.
2. Daily Time Frames: These frames depict the price action of a cryptocurrency over the course of a single trading day. Traders who plan to hold positions from one day to a few days find them useful.
3. Weekly and Monthly Time Frames: These longer-term frames illustrate price trends over weeks or months. Swing traders and long-term investors who focus on identifying broader market trends favor them and pay less attention to short-term variations.
Three Broad Categories of Crypto Chart Patterns
Chart patterns in cryptocurrency trading can be broadly categorized into:
1. Continuation Patterns
These patterns suggest that the existing trend will likely continue after a brief consolidation phase. Examples include flags, pennants, and various types of triangles.
2. Reversal Patterns
Reversal patterns indicate potential changes in trend direction, marking the end of the current trend and the beginning of a new one. Examples include head and shoulders, double tops and bottoms, and specific types of wedges.
3. Neutral Patterns
Neutral patterns, such as symmetrical triangles, indicate market indecision where neither buyers nor sellers have a definitive advantage. They often precede significant price movements.
Discussing Common Types of Crypto Trading Patterns
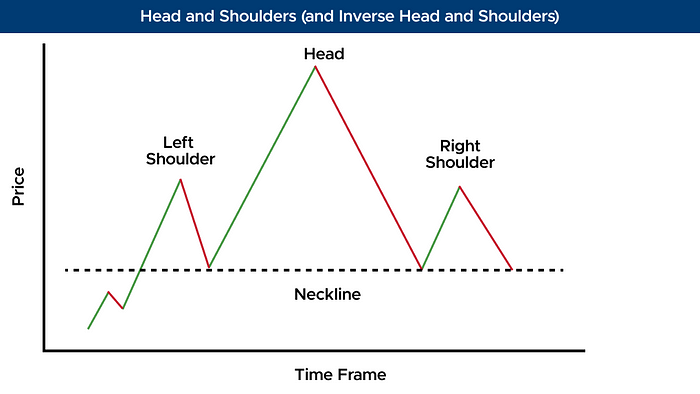
Head and Shoulders (and Inverse Head and Shoulders)

The head and shoulders pattern is a classic reversal pattern characterized by three peaks, with the middle peak (the head) being the highest. An inverse head and shoulders pattern indicates a potential trend reversal from bearish to bullish sentiment.
Double Top and Double Bottom

Double top and double bottom patterns occur when the price reaches similar peak or trough levels twice before reversing, signaling potential trend reversals.
Triangles (Symmetrical, Ascending, and Descending)
Symmetrical Triangle: This represents a period of indecision, with converging trendlines indicating a potential breakout.

- Ascending Triangle: Shows a bullish continuation pattern with a flat top and rising bottom trendline.

- Descending Triangle: Indicates a bearish continuation pattern with a flat bottom and descending top trendline.

Flags and Pennants
- Flags: Rectangular patterns that signal a brief consolidation phase before the previous trend resumes.

- Pennants: Small symmetrical triangles formed after sharp price movements, often leading to the continuation of the previous trend.

Wedges (Rising and Falling)
- Rising Wedge: Typically a bearish reversal pattern with upward-sloping converging trendlines.

- Falling Wedge: Generally, it is a bullish reversal pattern with downward-sloping converging trendlines.

NOTE: Wedge patterns in crypto trading charts can act as both continuation and reversal patterns.
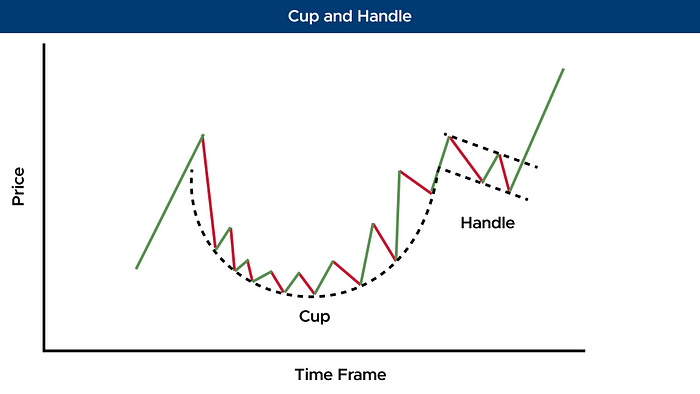
Cup and Handle

The cup and handle pattern resembles a tea cup on a chart, indicating a bullish continuation pattern where the price consolidates after an uptrend before resuming upward momentum.
Practical Tips for Trading Using Crypto Patterns
- Confirm Patterns with Volume: Validate chart patterns with significant trading volume to increase signal reliability.
- Combine with Other Indicators: Use technical indicators like moving averages, RSI, and MACD to confirm signals and refine trading decisions.
- Set Clear Entry and Exit Points: Define precise entry and exit points based on pattern confirmation, support/resistance levels, and risk management strategies.
- Practice Risk Management: Implement stop-loss orders and position sizing techniques to protect capital and manage risk effectively.
Conclusion
Mastering crypto chart patterns empowers crypto traders to navigate the volatile cryptocurrency markets confidently and precisely. Businesses can optimize trading outcomes and capitalize on market opportunities by understanding the nuances of different patterns. Stay informed, stay vigilant, and harness the power of crypto chart patterns to drive success in your trading endeavors.
Whether you’re looking to build sophisticated trading platforms, integrate advanced technical analysis features, or leverage cutting-edge blockchain technology for superior market insights, we’ve got you covered.
Contact our blockchain developers today and discover how we can help you create smarter, more efficient crypto trading solutions.
